Share Information
Back  Written by Philipp

One of the general challenges of building a highly configurable extension used by many people is this:
How do users actually use it?
That information is extremely valuable. It helps determine which features matter most, which settings cause confusion, what should be improved, and where future development time should be invested.
There are several ways to learn this.
The most direct one is user feedback. Some users send emails or messages explaining how they use Bookmark Sidebar, how many bookmarks they manage, or which workflows matter most to them.
That feedback is genuinely useful, but it only shows a small part of the overall picture.
Most users will never contact me, which is completely normal and honestly expected. With more than 500,000 users, it would also be impossible to personally answer every message in detail.
So the challenge becomes: how do you understand overall usage patterns without disturbing users or violating privacy?
Optional Data Sharing (Opt-In)
To solve that, Bookmark Sidebar includes an optional data sharing feature. This is strictly opt-in. By default, nothing is sent anywhere.
Users who choose to participate can anonymously share limited technical information that helps improve the extension. There are two categories:
1. Configuration Sharing
Anonymous configuration data helps identify:
- which settings are most commonly used
- which options are rarely touched
- which defaults work well
- what should be simplified or improved in future versions
If enabled, the extension periodically sends the current configuration state to my server.
2. Usage Activity Sharing
Anonymous interaction data helps understand how features are used in practice.
Examples:
- Is the search feature actively used?
- Do users change bookmark sorting?
- How often are bookmarks edited or rearranged?
- Which sidebar modes are popular?
- How many bookmarks do users typically manage?
Importantly:
- No bookmark titles are collected
- No bookmark URLs are collected
- No browsing history is collected
- No visited websites are tracked
The purpose is feature analytics, not surveillance.
Why This Matters
This type of aggregated data helps reveal things that individual feedback cannot. For example:
- A feature may seem useful, but almost nobody uses it
- A setting may confuse many users
- Some workflows may be much more common than expected
That makes it easier to prioritize development based on real usage instead of guesswork.
Privacy
I understand that “data sharing” often sounds negative. Many companies use analytics aggressively, collect excessive personal data, or monetize user behavior. That has understandably damaged trust.
That is not the approach here.
The data is stored on my own server in a German datacenter. It is not sold, shared with advertisers, or forwarded to third parties. A simplified example of submitted data could look like this:
{
  "browser": "Chrome v149",
  "os": "Windows",
  "mode": "overlay",
  "sidebarWidth": 200,
  "fontSize": 14,
  "bookmarkCount": 4321
}
This contains only technical metadata and configuration values. On the server side, these values are aggregated into counters by day, for example:
| Type | Key | Value | Count | Date |
|---|---|---|---|---|
| Browser | Chrome | 149 | 5641 | 2026-05-24 |
| OS | Windows | 11 | 7833 | 2026-05-24 |
| OS | Windows | 10 | 412 | 2026-05-24 |
| Config | Mode | overlay | 2346 | 2026-05-24 |
| Config | Mode | sidepanel | 3215 | 2026-05-24 |
That means individual records are turned into daily statistics. The result is simple trend analysis such as charts, usage distributions, compatibility insights, and feature adoption over time.
Insights
Interested in some real-world insights?
Here are a few examples based on anonymized usage data collected from users who explicitly opted in to share technical statistics.
These numbers are displayed in my internal admin dashboard, where I can analyze trends over time, compare selected date ranges, inspect historical changes, or monitor incoming data in near real time.
-
User Count
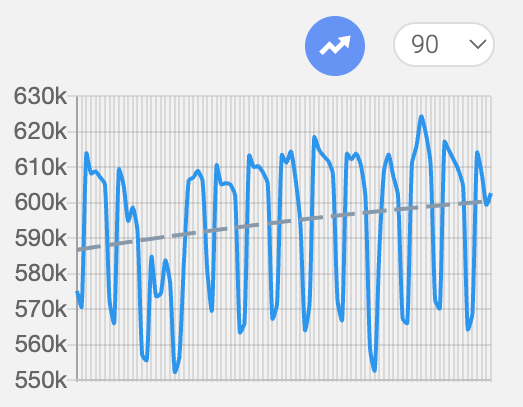
Number of users over the last 90 days, including the overall trend line.
Unlike the other statistics shown here, this data is not gathered through the optional sharing feature. It comes directly from the developer dashboards of the browser web stores (for example Chrome Web Store and Microsoft Edge Add-ons).
-
Bookmark Amount
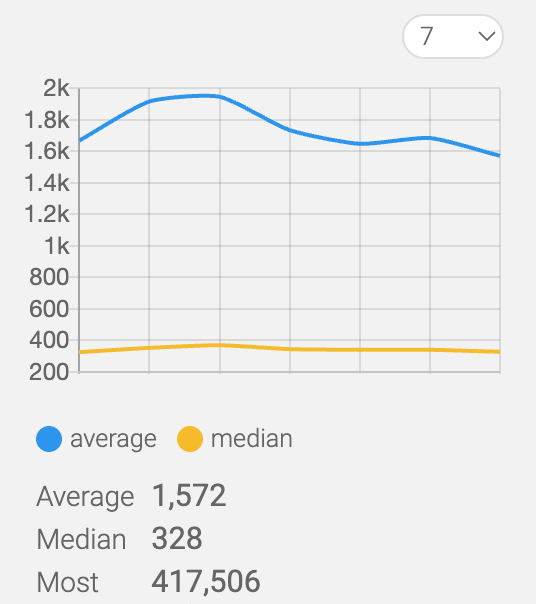
Average and median number of bookmarks during the last 7 days. And yes, one user appears to have more than 400,000 bookmarks. Impressive!
-
User Types
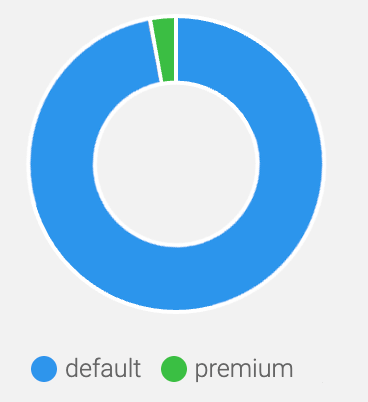
How many users rely on the free version compared to those who choose to support development through the premium upgrade.
-
Language Distributions
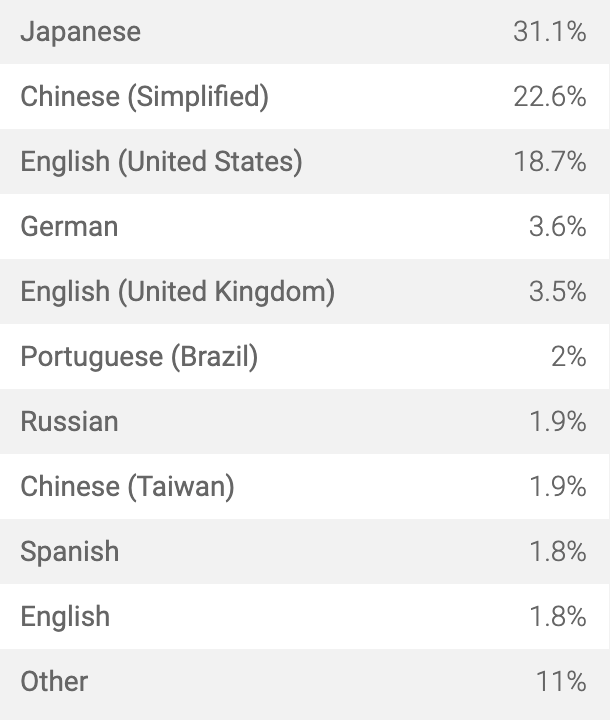
Language distribution of users based on their browser language settings. It gives a good overview of how internationally the extension is used and which languages are most common among the user base.
-
Sidebar Position
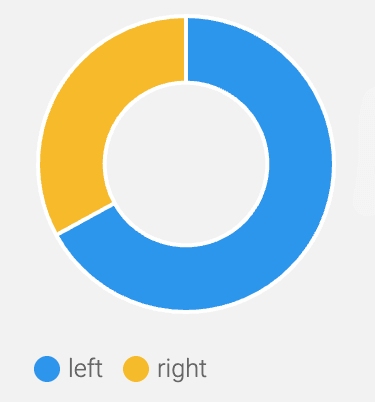
Distribution between users who place the sidebar on the left side of the browser window and those who prefer it on the right.
-
Color Scheme
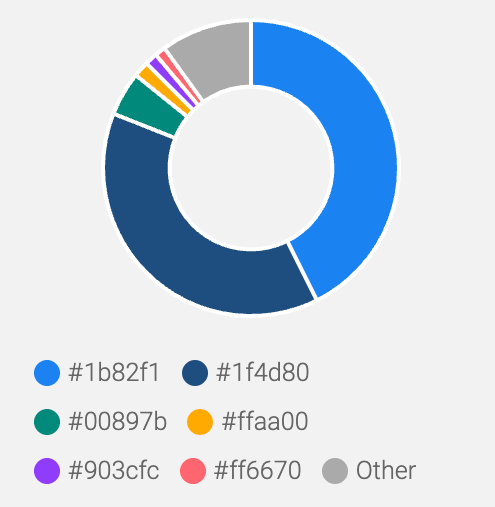
Distribution of configured color schemes chosen by users. Always interesting to see what colors some people choose.
-
Surface
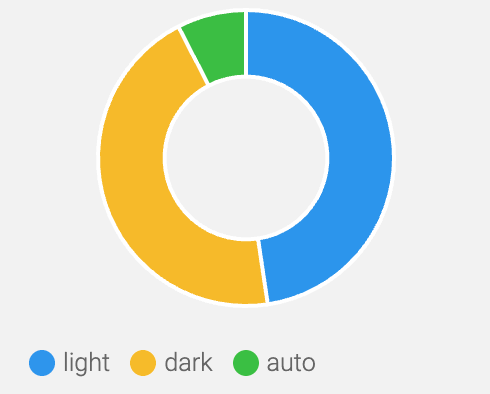
Distribution of the configured surface setting. The Auto option follows the operating system or browser preference and automatically switches between light and dark mode based on the current system setting.
-
Operating System
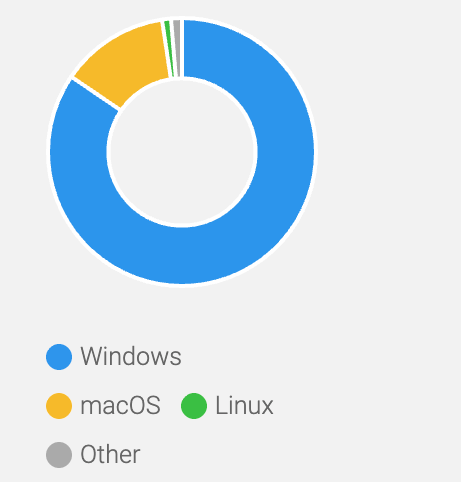
Distribution of operating systems used by users of the extension.
-
Installation Year
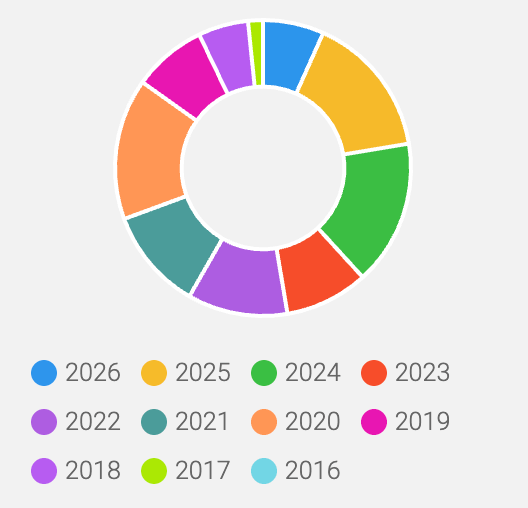
Distribution of the year in which users installed the extension.
If a user reinstalls the extension the original installation year is lost and replaced. As a result, older years naturally appear to “fade out” over time.